[신경망] MNIST 데이터를 이용한 CNN모델 코드
2020. 4. 23. 17:32ㆍ노트/Python : 프로그래밍

텐서플로우 기반
데이터 불러오기
import random
from tensorflow.examples.tutorials.mnist import input_data

mnist=input_data.read_data_sets("MNIST_data/", one_hot=True)

# 하이퍼 퍼러미터
lr = 0.001
epochs = 15
batch_size = 100
계층 생성
# 하이퍼 퍼러미터
lr = 0.001
epochs = 15
batch_size = 100

#그래프초기화 ( 변수선언 위에다 입력해야함)
tf.reset_default_graph()

# 입력층
keep_prob = tf.placeholder(tf.float32) # drop-out 추가
x = tf.placeholder(tf.float32, [None,28*28])
xlmg=tf.reshape(x,[-1,28,28,1])
y = tf.placeholder(tf.float32, [None,10])

# 히든 1 ( w1=filter )
w1 = tf.Variable(tf.random_normal([3,3,1,32]))
# 필터의 높이:3와 넓이:3, 채널의 갯수:1, 필터의 갯수:32
# conv -> (?,28,28,32)
# relu -> (?,28,28,32)
# pool -> (?,14,14,32)
L1= tf.nn.conv2d(xlmg, w1, strides=[1,1,1,1], padding="SAME")
# 활성화 함수 통과
L1 = tf.nn.relu(L1)
# Pooling
L1=tf.nn.max_pool(L1, ksize=[1,2,2,1], strides= [1,2,2,1], padding="SAME")
#(2,2) :윈도우 크기
L1=tf.nn.dropout(L1,keep_prob=keep_prob)

#히든 2
w2 = tf.Variable(tf.random_normal([3,3,32,64]))
# conv -> (?,14,14,64)
# relu -> (?,14,14,64)
# pool -> (?,7,7,64)
# flat -> (?, 3136)
L2 = tf.nn.conv2d(L1, w2, strides=[1,1,1,1], padding="SAME")
L2 = tf.nn.relu(L2)
L2 = tf.nn.max_pool(L2, ksize=[1,2,2,1], strides= [1,2,2,1], padding="SAME")
L2=tf.nn.dropout(L2,keep_prob=keep_prob)


L2_flat= tf.reshape(L2,[-1,7*7*64])

# 마지막계층  FC 7*7*64 -> 10 output
W3 = tf.get_variable("w3",shape=[7*7*64, 10], initializer=tf.contrib.layers.xavier_initializer())

b = tf.Variable(tf.random_normal([10]))
함수 정의 및 모델 생성
hf = tf.matmul(L2_flat, W3) + b

cost = tf.reduce_mean(tf.nn.softmax_cross_entropy_with_logits_v2(logits = hf , labels= y))
opt = tf.train.AdamOptimizer(lr).minimize(cost)
모델 실행
sess=tf.Session()
sess.run(tf.global_variables_initializer())

for epoch in range(epochs):
    avgCost = 0
    totalBatch= int(mnist.train.num_examples/batch_size)
    for i in range(totalBatch):
        batchX, batchY = mnist.train.next_batch(batch_size)
        fd = {x:batchX, y:batchY, keep_prob:0.7}
        cv,_=sess.run([cost, opt], feed_dict=fd)
        avgCost+=cv/totalBatch
    print("epoch:","%04d" %(epoch + 1 ), "cost=",avgCost)
pred= tf.equal(tf.argmax(hf,1), tf.argmax(y,1))
acc = tf.reduce_mean(tf.cast(pred, tf.float32))
print("accuracy:", sess.run(acc, feed_dict={x:mnist.test.images, y:mnist.test.labels , keep_prob:1}))
# accuracy: 0.9853 (keep_prob 추가 안 했을 때, )
# accuracy: 0.9839 (keep_prob 추가 했을 때,)

epoch: 0001 cost= 4.443909129879689
epoch: 0002 cost= 0.9400658628683196
epoch: 0003 cost= 0.5079063882348551
epoch: 0004 cost= 0.35302575529214353
epoch: 0005 cost= 0.26660195535641473
epoch: 0006 cost= 0.21027934439945956
epoch: 0007 cost= 0.18708037155976703
epoch: 0008 cost= 0.16399812486319043
epoch: 0009 cost= 0.14049976978070006
epoch: 0010 cost= 0.13282363239210107
epoch: 0011 cost= 0.122104285933416
epoch: 0012 cost= 0.11527511923658573
epoch: 0013 cost= 0.11351769800710662
epoch: 0014 cost= 0.10328966909638512
epoch: 0015 cost= 0.09901341474869041
accuracy: 0.9841
케라스 기반 CNN모델
데이터 불러오기

from keras.datasets import mnist
from keras.utils import np_utils
import numpy as np
import sys
import tensorflow as tf


(xTrain, yTrain ), (xTest, yTest)= mnist.load_data()

print(xTrain.shape)
print(yTrain.shape)
print(xTest.shape)
print(yTest.shape)
>>>
(60000, 28, 28)
(60000,)
(10000, 28, 28)
(10000,)

import matplotlib.pyplot as plt

plt.imshow(xTrain[0], cmap="Greys")
plt.show()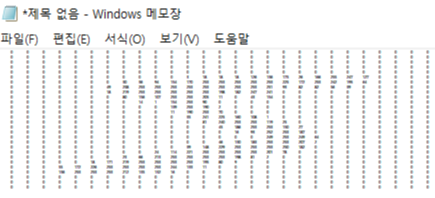
for x in xTrain[0]:
    for i in x:
        sys.stdout.write("%d\t" % i)
    sys.stdout.write("\n") #표준출력장치 (모니터)로 출력하여라
(xTrain, yTrain ), (xTest, yTest)= mnist.load_data()

xTrain=xTrain.reshape(xTrain.shape[0],28,28,1)
xTrain=xTrain.astype("float64")
xTrain=xTrain/255

xTest=xTest.reshape(xTest.shape[0],28,28,1).astype("float64")/255

yTrain=np_utils.to_categorical(yTrain,10)
yTest=np_utils.to_categorical(yTest,10)
모델 구성
from keras.models import Sequential
from keras.layers import Dense
from keras.callbacks import ModelCheckpoint, EarlyStopping
import numpy as np
import tensorflow as tf
import os
from keras.layers import *
model = Sequential()
model.add(Conv2D(32, kernel_size=(3,3) , input_shape = (28,28,1), activation = 'relu'))
#Conv2D(필터갯수, 필터크기 ,(행,열,흑백),활성화함수)
model.add(Conv2D(64, (3,3), activation = 'relu'))
model.add(MaxPooling2D(pool_size=2))
model.add(Dropout(0.25)) # 드롭아웃 비율 (25%)
"""
드롭아웃 (dropout)
- 오버피팅 감소
- 히든계층의 노드 중 일부를 선택하여 학습하는 기법
- 학습데이터에 지나치게 치우쳐서 학습되는 과적합을 방지
"""
# Flatten(): 1치원으로 변경하는 함수
model.add(Flatten())
model.add(Dense(128,activation='relu'))
model.add(Dropout(0.5))
model.add(Dense(10, activation='softmax'))
# 모델 환경설정
model.compile(loss="categorical_crossentropy",
optimizer = "adam",
metrics=['accuracy'])
#모델 최적화 기록
modelDir = './myCnnModel/'
if not os.path.exists(modelDir): # 만약 myModel directory가 존재하지 않는다면
modelPath = "./myCnnModel/{epoch:02d}-{val_loss:.4f}.hdf5"
os.mkdir(modelDir)
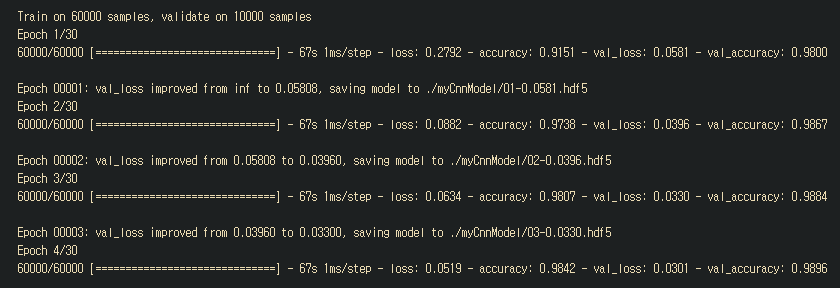
checkpointer = ModelCheckpoint(filepath=modelPath, monitor = 'val_loss', verbose=1 , save_best_only=True )
# ModelCheckpoint: 콜백함수 : 어떤 상황이 되면 시스템에 의해서 호출되는 함수 ,
# keras에서 모델을 학습할 때마다 중간중간에 콜백형태로 알려줌
# save_best_only: 모델의 정확도가 최고값을 갱신할때만 저장
es = EarlyStopping(monitor='val_loss', patience=10)
모델 실행
history= model.fit(xTrain, yTrain,validation_data=(xTest,yTest),
                   epochs=30, batch_size=200, callbacks=[es,checkpointer])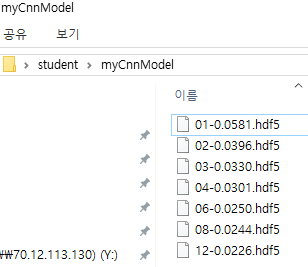
모델 평가
print("테스트 정확도: %.4f" %(model.evaluate(xTest,yTest)[1]))

10000/10000 [==============================] - 3s 311us/step
테스트 정확도: 0.9938
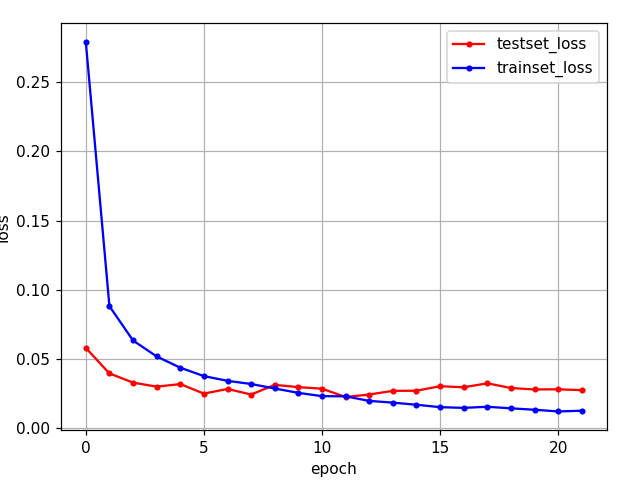
# 테스트 셋의 오차
yVloss = history.history['val_loss']
# 학습 셋의 오차
yLoss=history.history['loss']

%matplotlib notebook
xLen = np.arange(len(yLoss))
plt.plot(xLen, yVloss, marker=".", c="red", label="testset_loss")
plt.plot(xLen, yLoss, marker=".", c="blue", label="trainset_loss")
plt.legend()
plt.grid()
plt.xlabel('epoch')
plt.ylabel('loss')
plt.show()
모델 사용
# 모델 예측하기
import pandas as pd

index=[]
ori=[]
pred=[]

for i in range(0, xTest.shape[0]):
    if np.argmax(yHat[i]) != np.argmax(yTest[i]):
        index.append(i)
        ori.append(np.argmax(yTest[i]))
        pred.append(np.argmax(yHat[i]))
res=pd.DataFrame({"label":ori,
                  "predict":pred},
                 index=index)
print(res)

      label  predict
321       2        7
340       5        3
359       9        4
445       6        0
659       2        1
...     ...      ...
9664      2        7
9692      9        7
9729      5        6
9770      5        0
9839      2        7

[62 rows x 2 columns
# 예측이 틀린 이미지를 8개 정도 출력
# label : 9, prediction : 4
ver=res.sample(n=16).index
%matplotlib notebook
cnt=0
for n in ver:
cnt+=1
plt.subplot(4,4,cnt)
plt.imshow(xTest[n].reshape(28,28), cmap='Greys')
t="label:"+str(res['label'][n])+"pred:"+str(res['predict'][n])
plt.title(t)
plt.tight_layout()
plt.show()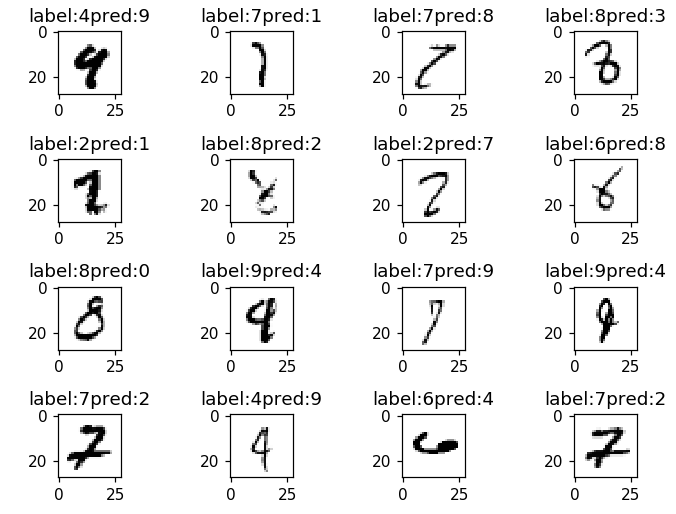
케라스 기반 분류 (CNN모델 아님)
2020/04/21 - [노트/Python : 프로그래밍] - [텐서플로우/케라스] MNIST 숫자 분류하기 (softmax)
'노트 > Python : 프로그래밍' 카테고리의 다른 글
| [케라스 오류 해결] TypeError: The added layer must be an instance of class Layer (0) | 2020.04.24 |
|---|---|
| [케라스] 이미지 증식하기 코드 (1) | 2020.04.24 |
| [케라스/텐서플로우] 주택가격 예측하기 코드 (0) | 2020.04.23 |
| [케라스] 영화리뷰 긍정부정 분류하기 (0) | 2020.04.22 |
| [파이썬] 데이터시각화(2) (seaborn 패키지) (0) | 2020.04.22 |