[텐서플로우] 주식가격 예측하기(1) 파이썬 코드
2020. 4. 18. 14:35ㆍ노트/Python : 프로그래밍

데이터
data-02-stock_daily.csv
0.04MB
# tensorflow
import tensorflow as tf
# keras
from keras.datasets import mnist
from keras.models import Sequential
from keras.layers import Dense, Activation
from keras.utils import np_utils
path = "C:\\Users\\student\\Desktop\\DY\\★ 데이터\\105. deep-learning-dataset\\"
data = pd.read_csv(path+"data-02-stock_daily.csv", header=1)
data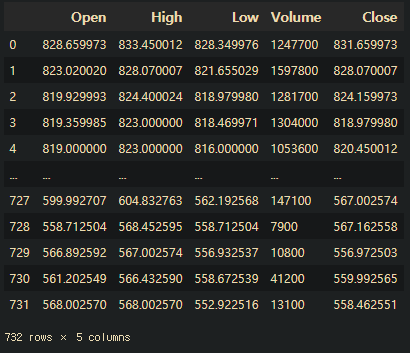
# 데이터 시각화
import matplotlib.pyplot as plt
%matplotlib inline

fig=plt.figure(figsize=(30,20))
ax1=fig.add_subplot(3,1,1)
ax2=fig.add_subplot(3,1,2)
ax3=fig.add_subplot(3,1,3)

ax1.plot(data['Open'])
ax1.plot(data['High'])
ax1.plot(data['Low'])
ax1.plot(data['Close'])

ax2.plot(data['Volume'])

ax3.plot(data['Open'][0:7], linewidth=3.0,label= "Open")
ax3.plot(data['High'][0:7],  linewidth=3.0 ,label= "High")
ax3.plot(data['Low'][0:7],   linewidth=3.0,label= "Low")
ax3.plot(data['Close'][0:7], linewidth=3.0 ,label= "Close")

ax3.legend(prop={'size': 30})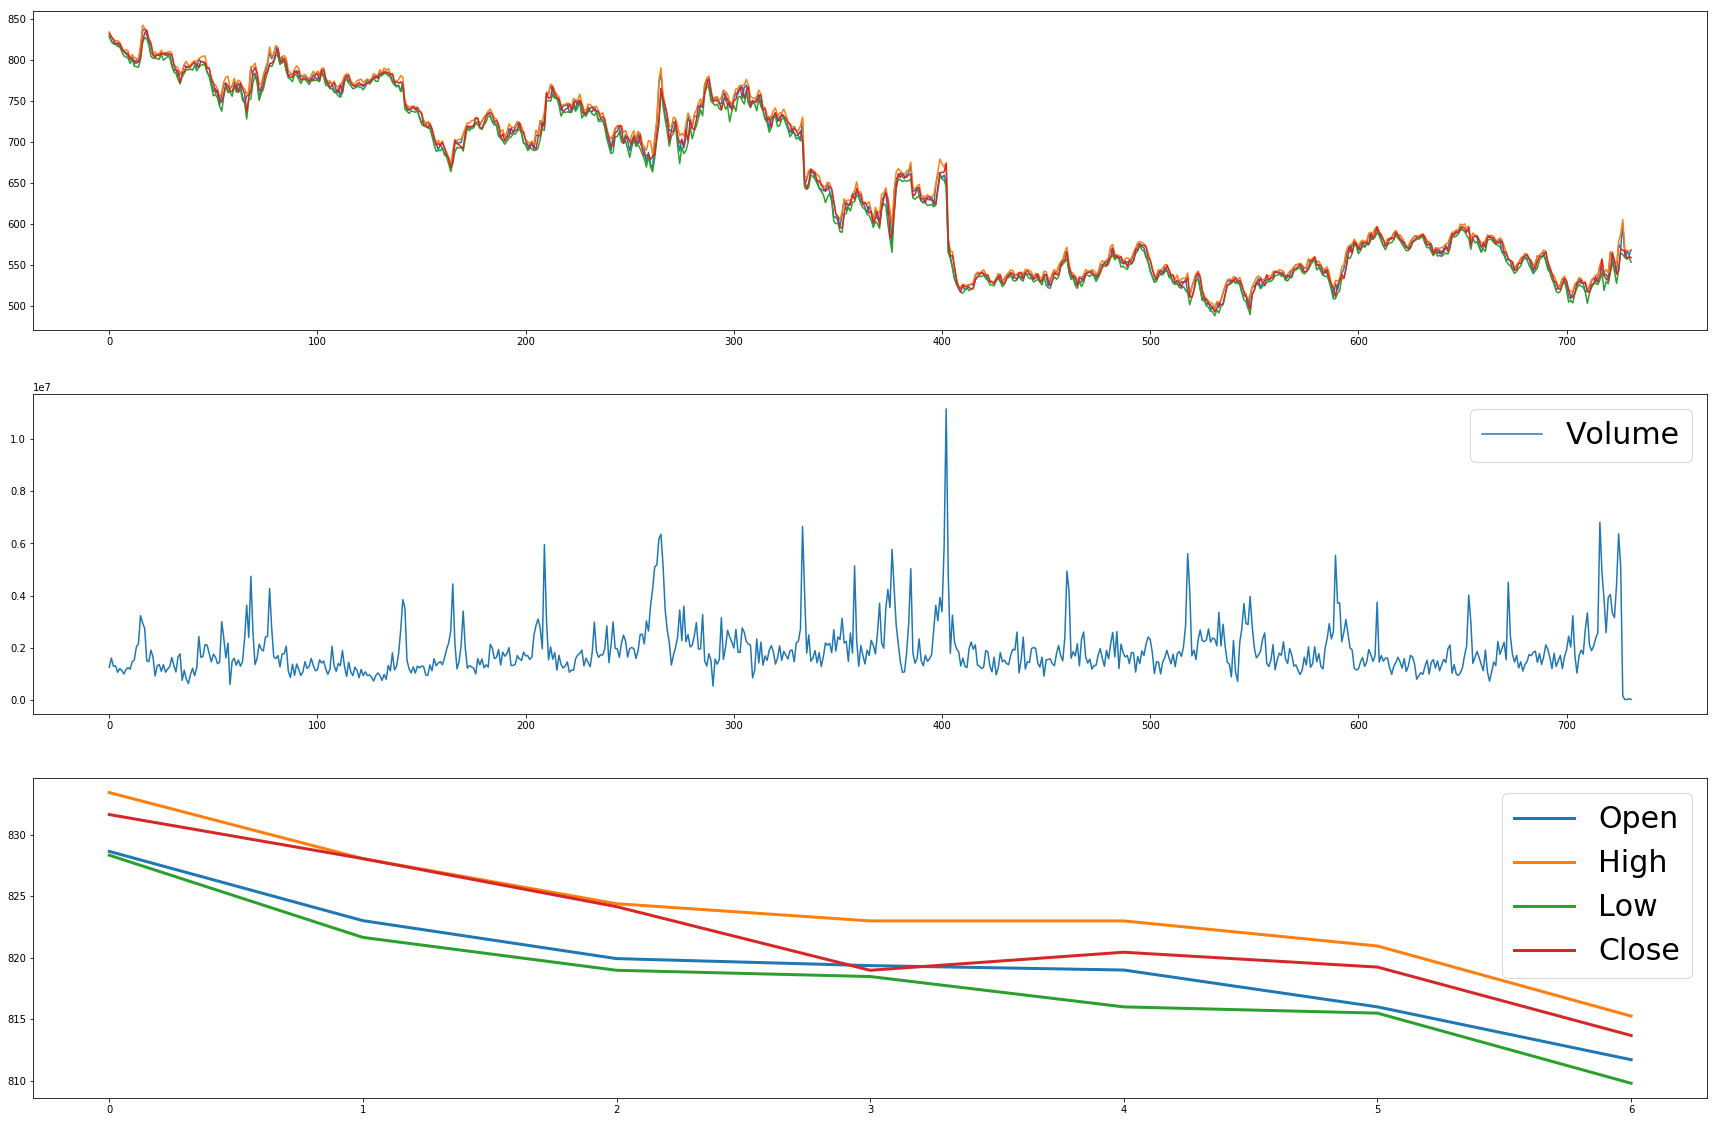
# Open, High, Low , Volume으로 Close 가격 예측하기
xdata=data[["Open","High","Low","Volume"]]
ydata=pd.DataFrame(data["Close"])

# 데이터 표준화
from sklearn.preprocessing import StandardScaler

xdata_ss=StandardScaler().fit_transform(xdata)
ydata_ss=StandardScaler().fit_transform(ydata)

print(xdata_ss.shape , ydata_ss.shape)
>>>(732, 4) (732, 1)

# 트레이닝 테스트 데이터 분리
xtrain=xdata_ss[220:,:]
xtest=xdata_ss[:220,:]
ytrain=ydata_ss[220:,:]
ytest=ydata_ss[:220,:]

print( xtrain.shape , ytrain.shape , xtest.shape, ytest.shape)
>>> (512, 4) (512, 1) (220, 4) (220, 1)
모델 생성
# 변수선언
w = tf.Variable(tf.random_normal([4,1])) # 1: 출력되는 y의 갯수
b = tf.Variable(tf.random_normal([1])) # 1: 출력되는 y의 갯수
x = tf.placeholder(tf.float32, shape = [None,4])
y = tf.placeholder(tf.float32, shape = [None,1])

# 가설함수
hf = tf.matmul(x,w)+b

# 비용함수
cost = tf.reduce_mean(tf.square(y-hf))

# 트레이닝 함수
train = tf.train.GradientDescentOptimizer(0.01).minimize(cost)
모델 실행
# 트레이닝 및 테스트

with tf.Session() as sess:
    sess.run(tf.global_variables_initializer())
    for step in range(2001):
        cv, hfv,_ = sess.run([cost, hf, train], feed_dict = {x:xtrain, y:ytrain})
        if step % 200==0:
            print(step, "cost:",cv, "\n prediction:",hfv)
    hfv, wv, bv = sess.run([hf,w,b],feed_dict = {x:xtest,y:ytest})
    print("Evaluate : {}".format(np.average((hfv - ytest)**2)))

>>>
0 cost: 2.7267168
 prediction: [[-1.04939806e+00]
 [-1.51418054e+00]
 [-1.37437391e+00]
 [-1.41481233e+00]
 ........

 Evaluate : 0.0049429809261321055
예측값과 실제값 비교
tf_predicted = np.dot(xdata_ss, wv )+ bv

plt.figure()
plt.plot(tf_predicted[:220], label="predict")
plt.plot(ytest,label="actual")

plt.legend(prop={'size': 20})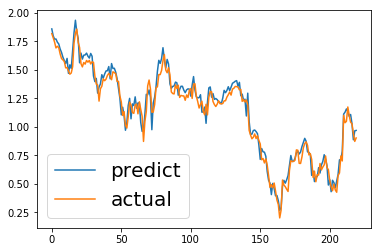
케라스 버전 확인하기
2020/04/18 - [노트/Python : 프로그래밍] - [케라스] 주식가격 예측하기(2) 파이썬 코드
'노트 > Python : 프로그래밍' 카테고리의 다른 글
| [파이썬] 데이터시각화(1) (matplotlib.pyplot 패키지) (0) | 2020.04.20 |
|---|---|
| [케라스] 주식가격 예측하기(2) 파이썬 코드 (0) | 2020.04.18 |
| [파이썬] 데이터변형 | 재구조화 (피벗테이블) (0) | 2020.04.18 |
| [텐서플로우] 다중 선형 회귀를 이용한 당뇨병 분류기 파이썬 코드 (0) | 2020.04.18 |
| [케라스] 암 분류기 , 당뇨병 분류기 파이썬 코드 (0) | 2020.04.18 |