2020. 4. 16. 16:10ㆍ노트/Python : 프로그래밍

★실행 환경
|
tensorboard 1.15.0 Python 3.7.4
|
로지스틱 회귀 (Logistic Regression)
$H(x) = {1 \over (1+ e^(-WtX) ) } $
$ cost(W) = { -1 \over m} * \sum y*\log(H(x)) +(1-y)(\log(1-H(x))$
$ W:= W - \alpha * { \partial \over \partial W}*cost(W)$
로지스틱 회귀(영어: logistic regression)는 영국의 통계학자인 D. R. Cox가 1958년 에 제안한 확률 모델로서 독립 변수의 선형 결합을 이용하여 사건의 발생 가능성을 예측하는데 사용되는 통계 기법이다.
예제데이터
xdata = [[1,2],
        [2,3],
        [3,1],
        [4,3],
        [5,3],
        [6,2]]

ydata = [[0],
        [0],
        [0],
        [1],
        [1],
        [1]]
$ y = x*w+b $ 의 가설함수 (hypothesis function)을 만들고, 실제 y값과 비교하여 정확도를 비교해보자.
변수정의
x=tf.placeholder(tf.float32 , shape = [None,2])
y=tf.placeholder(tf.float32 , shape = [None,1])

w=tf.Variable(tf.random_normal([2,1]))
b=tf.Variable(tf.random_normal([1]))

hf =tf.sigmoid(tf.matmul(x,w)+b)

cost = - tf.reduce_mean(y* tf.log(hf)+ (1-y)*(tf.log(1-hf)))

train = tf.train.GradientDescentOptimizer(0.01).minimize(cost)- x는 데이터 자체 갯수는 모르기 때문에 행은 None으로 두지만, 열은 2개기 때문에 2로 둔다.
- y도 마찬가지로 1열이기 때문에 행은 비워두고 열 칸에 1로 둔다.
- w와 b는 변수기 때문에 변수선언을 하고, w의 shape 지정
- hypothesis function (hf)는 x와 y의 행렬 연산한 값의 sigmoid 함수를 대입하여 최대 1, 최소0 이나오도록 한다.
- (왜냐하면 0또는 1로 분류할 것이기 때문이다.)
- cost함수는 아래와 같다.
- 예측의 정확도를 높이기 위해, cost를 최소화 하는 방향으로 진행된다는 의미이다.
- 그다음 데이터 트레이닝을 시킨다.
# 0.5 기준 (크면 ->1.0, 작으면 ->0.0)
predicted = tf.cast(hf>0.5, dtype=tf.float32)
accuracy = tf.reduce_mean(tf.cast(tf.equal(predicted,y),dtype=tf.float32))
cast함수는 나온 결과의 형식을 지정해주는 함수이다.
결과 표시
step_list=[]
cost_list=[]
with tf.Session() as sess:
sess.run(tf.global_variables_initializer())
for step in range(20001):
_,cv= sess.run([train, cost], feed_dict={x:xdata,y:ydata})
if step%1000==0:
print(step,cv )
step_list.append(step)
cost_list.append(cv)
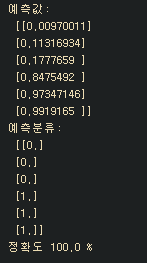
hv, pv, av= sess.run([hf, predicted, accuracy], feed_dict={x:xdata,y:ydata})
print("예측값:\n",hv, "\n예측분류:\n",pv,"\n정확도",av*100,"%")
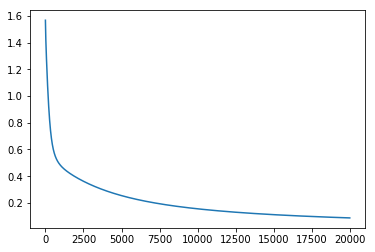
plt.plot(step_list,cost_list)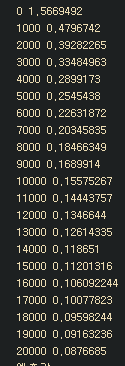
모델비교
2020/04/20 - [노트/Python : 프로그래밍] - [텐서플로우] 소프트맥스 회귀 (Softmax Regression) 분류 파이썬 코드
2020/04/18 - [노트/Python : 프로그래밍] - [텐서플로우] 다중 선형 회귀를 이용한 당뇨병 분류기 파이썬 코드
2020/04/17 - [노트/Python : 프로그래밍] - [텐서플로우] 다중회귀분석 (Multi-variable Linear Regression) 파이썬 코드
2020/04/14 - [노트/Python : 프로그래밍] - [텐서플로우] 선형회귀분석(Linear Regression) 기본 구조 파이썬 코드
Tensorflow 2.0 versioin 으로 code update
xdata = [[1.0,2.0],
        [2.0,3.0],
        [3.0,1.0],
        [4.0,3.0],
        [5.0,3.0],
        [6.0,2.0]]

ydata = [[0.0],
        [0.0],
        [0.0],
        [1.0],
        [1.0],
        [1.0]]
import tensorflow as tf
import matplotlib.pyplot as plt
class Model(object):
def __init__(self, x, y):
self.w = tf.Variable(tf.random.normal(shape=(len(x),len(x[0]))), name = "w")
self.b = tf.Variable(tf.random.normal((len(y),)))
def __call__(self, x):
return self.w * x + self.b
model = Model(xdata,ydata)
# x = tf.placeholder(tf.float32 , shape = [None,2]) #TF V2. 더이상 사용 안함
# y = tf.placeholder(tf.float32 , shape = [None,1])
w = tf.Variable(tf.random.normal(shape=(2,1)), name = "w")
b = tf.Variable(tf.random.normal(shape=[1]), name = "b")
def model(xdata):
hf = tf.sigmoid(tf.linalg.matmul(xdata,w)+b)
return hf
def loss(hf, ydata):
loss = ydata * tf.math.log(hf) + (tf.ones(2,1)-ydata)*tf.math.log(tf.ones(2,1)-hf)
cost = -tf.math.reduce_mean(loss)
return cost
opt = tf.keras.optimizers.SGD(learning_rate = 0.01)
#0.5 기준 크면->1.0 작으면 ->0.0
predicted = tf.cast(hf>0.5, dtype=tf.float32)
accuracy = tf.reduce_mean(tf.cast(tf.equal(predicted,ydata), dtype=tf.float32))
cost_list=[]
def train(model, inputs, outputs):
with tf.GradientTape() as t:
current_loss = loss(model(inputs), outputs)
cost_list.append(current_loss)
grads = t.gradient(current_loss, [w, b])
optimizer.apply_gradients(zip(grads,[w, b]))
step_list = []
for step in range(10000):
train(model,xdata,ydata)
step_list.append(step)
plt.plot(step_list, cost_list)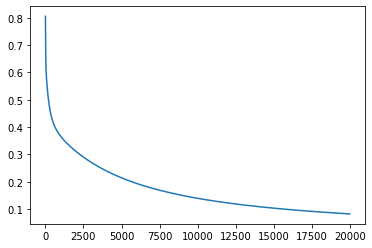

정확도가 떨어져서 기존에 sess.run 하던 부분 대대적으로 수정 필요 ㅠㅠ
'노트 > Python : 프로그래밍' 카테고리의 다른 글
| [케라스] Keras 모델 생성 기본 구조 (0) | 2020.04.17 |
|---|---|
| [텐서플로우] 다중회귀분석 (Multi-variable Linear Regression) 파이썬 코드 (0) | 2020.04.17 |
| [텐서플로우] 선형회귀분석(Linear Regression) 기본 구조 파이썬 코드 (0) | 2020.04.14 |
| [파이썬] 데이터변형 | 정규화와 표준화 (0) | 2020.04.14 |
| [파이썬기초] 데이터 합치기(병합) (0) | 2020.04.13 |